

Skip to content
Official PYQ · 2015

GATE CS 2015 Set 3 QGA-10 — General Aptitude

Explain with AI

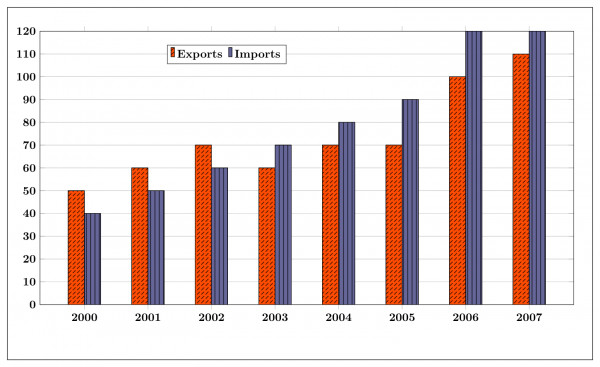
The exports and imports (in crores of RsRs.) of a country from the year 20002000 to 20072007 are given in the following bar chart. In which year is the combined percentage increase in imports and exports the highest?
View worked solution

Answer: 2006

To find the year with the highest combined percentage increase in imports and exports, we first calculate the combined value (Exports + Imports) for each year from the bar chart:

  • 2000: 30+40=7030 + 40 = 70
  • 2001: 40+50=9040 + 50 = 90
  • 2002: 50+60=11050 + 60 = 110
  • 2003: 60+70=13060 + 70 = 130
  • 2004: 70+80=15070 + 80 = 150
  • 2005: 80+90=17080 + 90 = 170
  • 2006: 120+130=250120 + 130 = 250
  • 2007: 130+140=270130 + 140 = 270

Next, we calculate the percentage increase for each year relative to the previous year:

  • 2001: 90−7070×100%≈28.57%\frac{90 - 70}{70} \times 100\% \approx 28.57\%
  • 2002: 110−9090×100%≈22.22%\frac{110 - 90}{90} \times 100\% \approx 22.22\%
  • 2003: 130−110110×100%≈18.18%\frac{130 - 110}{110} \times 100\% \approx 18.18\%
  • 2004: 150−130130×100%≈15.38%\frac{150 - 130}{130} \times 100\% \approx 15.38\%
  • 2005: 170−150150×100%≈13.33%\frac{170 - 150}{150} \times 100\% \approx 13.33\%
  • 2006: 250−170170×100%=80170×100%≈47.06%\frac{250 - 170}{170} \times 100\% = \frac{80}{170} \times 100\% \approx 47.06\%
  • 2007: 270−250250×100%=8.00%\frac{270 - 250}{250} \times 100\% = 8.00\%

The highest combined percentage increase occurs in the year 2006 with approximately 47.06%47.06\%.

Free practice · Your answers on this page are not saved.

Published
Report a correction
Keep exploringMore General Aptitude questions