



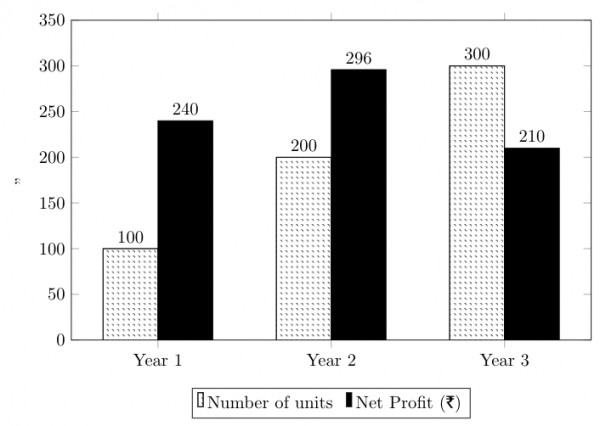
The number of units of a product sold in three different years and the respective net profits are presented in the figure above. The cost/unit in Year was ₹, which was half the cost/unit in Year . The cost/unit in Year was one-third of the cost/unit in Year . Taxes were paid on the selling price at , , and respectively for the three years. Net profit is calculated as the difference between the selling price and the sum of cost and taxes paid in that year.
The ratio of the selling price in Year to the selling price in Year is _________.
View worked solution
Answer: A
From the given problem statement, we first determine the cost per unit () for each year:
- Cost per unit in Year 3 () = ₹
- Cost per unit in Year 2 () = = ₹
- Cost per unit in Year 1 () = = ₹
From the bar graph, we obtain the number of units sold and the total net profit for Year 2 and Year 3:
- Year 2: Units sold = , Total Net Profit = ₹
- Year 3: Units sold = , Total Net Profit = ₹
Let and be the selling prices per unit in Year 2 and Year 3 respectively.
For Year 2:
For Year 3:
Thus, the ratio of the selling price in Year 2 to that in Year 3 is:
Free practice · Your answers on this page are not saved.