



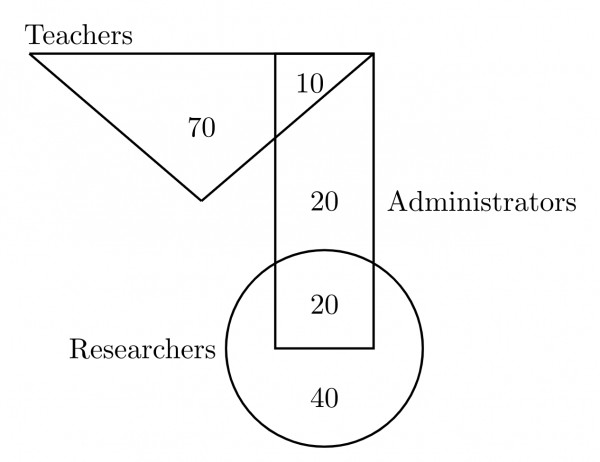
In the given diagram, teachers are represented in the triangle, researchers in the circle and administrators in the rectangle. Out of the total number of the people, the percentage of administrators shall be in the range of _______
View worked solution
Answer: C
To find the percentage of administrators, we first identify the values corresponding to each region in the given Venn diagram:
- Only Teachers (Triangle only):
- Only Researchers (Circle only):
- Only Administrators (Rectangle only):
- Teachers & Researchers only:
- Teachers & Administrators only:
- Researchers & Administrators only:
- All three categories:
Now, we calculate the total number of people in the diagram:
Next, we find the total number of administrators, which is the sum of all regions inside the rectangle:
The percentage of administrators is calculated as:
Since falls in the range of to , the correct option is C.
Free practice · Your answers on this page are not saved.