



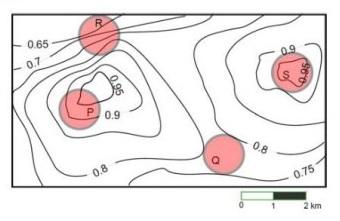
An air pressure contour line joins locations in a region having the same atmospheric pressure. The following is an air pressure contour plot of a geographical region. Contour lines are shown at bar intervals in this plot.
If the possibility of a thunderstorm is given by how fast air pressure rises or drops over a region, which of the following regions is most likely to have a thunderstorm?
View worked solution
Answer: C
The possibility of a thunderstorm is determined by how fast the air pressure rises or drops over a region. Mathematically, this corresponds to the pressure gradient (the rate of change of pressure with respect to distance).
In a contour plot:
- Closely spaced contour lines indicate a steep gradient, meaning pressure changes rapidly over a short distance.
- Widely spaced contour lines indicate a gentle gradient, meaning pressure changes slowly.
By observing the given contour plot:
- In region , the contour lines are packed closest together, representing the steepest pressure gradient (most rapid change in pressure).
- In regions , , and , the contour lines are relatively far apart.
Since region has the fastest change in air pressure, it is the most likely to experience a thunderstorm.
Hence, the correct option is C.
Free practice · Your answers on this page are not saved.