



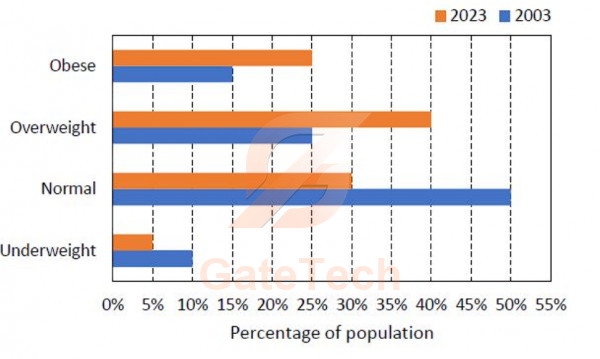
The bar chart shows the data for the percentage of population falling into different categories based on Body Mass Index in and .
Based on the data provided, which one of the following options is INCORRECT?
View answer
Answer: C
Worked explanation not available yet.
Free practice · Your answers on this page are not saved.