



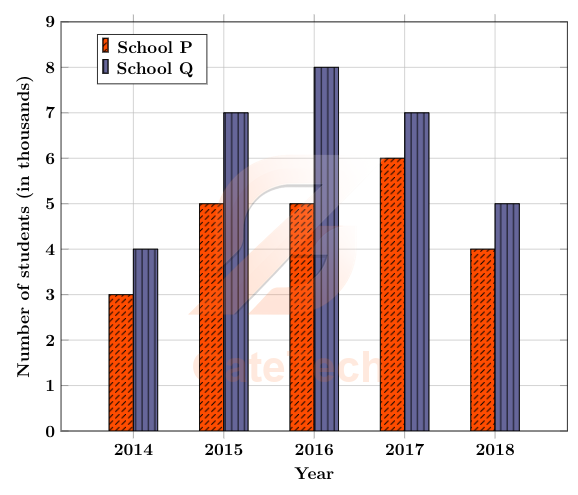
The following figure shows the data of students enrolled in years for two schools and . During this period, the ratio of the average number of the students enrolled in school to the average of the difference of the number of students enrolled in schools and is _______.
View answer
Answer: B
Worked explanation not available yet.
Free practice · Your answers on this page are not saved.