



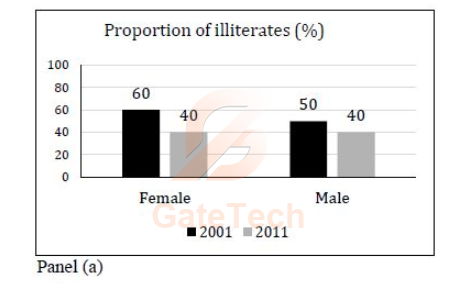
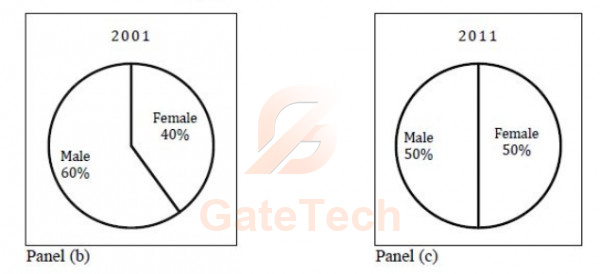
The bar graph in panel (a) shows the proportion of male and female illiterates in and The proportions of males and females in and are given in Panel (b) and (c), respectively. The total population did not change during this period. The percentage increase in the total number of literates from to is ______.
View answer
Answer: A
Worked explanation not available yet.
Free practice · Your answers on this page are not saved.