



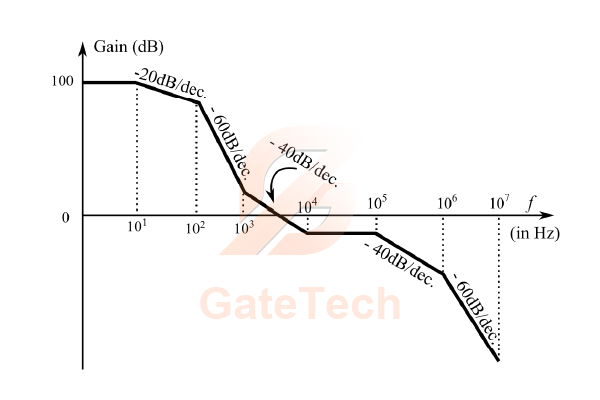
For an LTI system, the Bode plot for its gain is as illustrated in the figure shown. The number of system poles and the number of system zeros in the frequency range is
View answer
Answer: B
Worked explanation not available yet.
Free practice · Your answers on this page are not saved.