



The Venn diagram shows the preference of the students population for leisure activities.
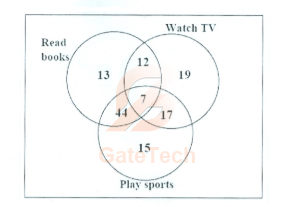
From the data given, the number of students who like to read books or play sports is _____.
View answer
Answer: D
Worked explanation not available yet.
Free practice · Your answers on this page are not saved.