
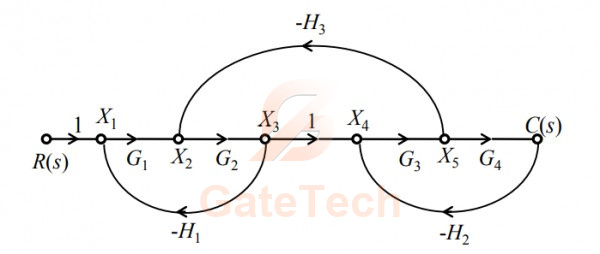
For the signal flow graph shown in the figure, the value of is
View answer
Answer: B
Worked explanation not available yet.
Free practice · Your answers on this page are not saved.



For the signal flow graph shown in the figure, the value of is
Answer: B
Worked explanation not available yet.
Free practice · Your answers on this page are not saved.