



In the figure, is plotted as a function of , where is the intrinsic resistivity of silicon, is the temperature, and the plot is almost linear.
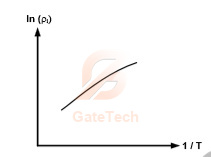
The slope of the line can be used to estimate
View answer
Answer: A
Worked explanation not available yet.
Free practice · Your answers on this page are not saved.