



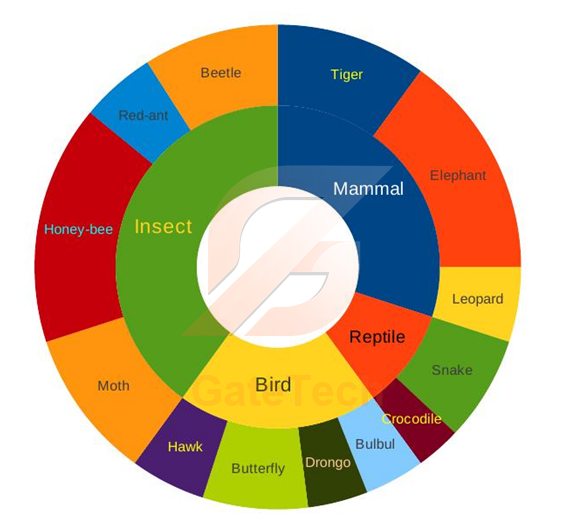
The multi-level hierarchical pie chart shows the population of animals in a reserve forest. The correct conclusions from this information are:
- (i) and (ii) only
- (i), (ii), (iii) and (iv)
- (i), (iii) and (iv) only
- (i), (ii) and (iii) only
View answer
Answer: D
Worked explanation not available yet.
Free practice · Your answers on this page are not saved.